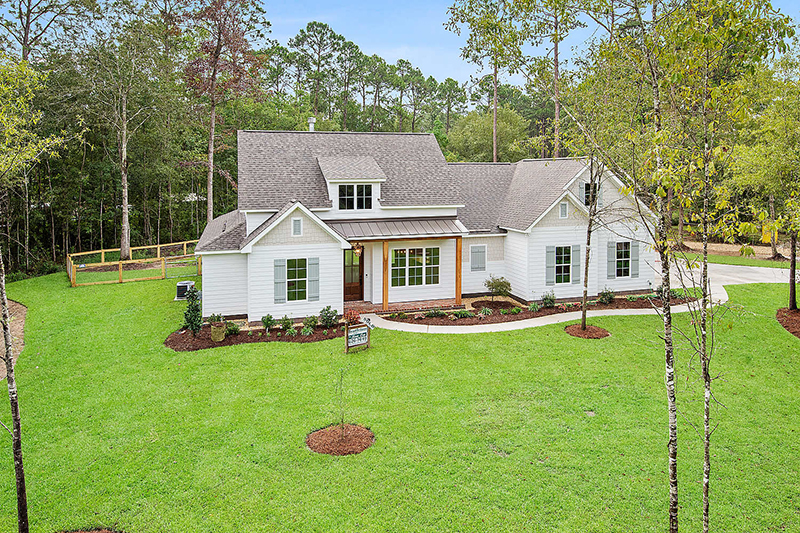
September Sees Gains in Single-Family Permits
 September 2020 brought a 10.2% increase over September 2019 in single-family permits issued year-to-date (YTD) according to the U.S. Census Building Permits. In fact, the report shows that over the first nine months of this year, the total nationwide climbed to 713,286.
As for each region of the country, the year-to-date ending in September varied. For single-family permits the Southeast saw the highest increase at 12.4%, the Midwest came in at the second-highest with a 10% increase, the West had a 6.3% increase and the Northeast saw the smallest increase at 6.2%. Multifamily permits did not fair so great. Every region saw a decline with the biggest decline in the West at -9.4%, the Northeast had a decline of -7.5%, the South at -5.6% and Midwest had a decline of -2.7%.
Among the states, only 42 states had a growth in single-family permits while the remaining 8 states and the District of Columbia resulted in a decline. The record highest growth was seen in South Dakota from 2,186 to 2,885 making this a 32% increase. The District of Columbia saw the steepest decline with a 22.2% drop from 126 to 98.
The multi-family sector was not so lucky. YTD only 18 states showed growth while the remaining 32 states and the District of Columbia showed a decline. Mississippi had the biggest increase from 246 to 588 while New Hampshire had the largest decline from 1,148 to 386.
The top 10 metro areas with the highest number of single-family permits were:
| Metropolitan Statistical Area | Single-family Permits: Sep (Units #YTD, NSA) |
| Houston-The Woodlands-Sugar Land, TX | 35,309 |
| Dallas-Fort Worth-Arlington, TX | 31,631 |
| Phoenix-Mesa-Scottsdale, AZ | 22,566 |
| Atlanta-Sandy Springs-Roswell, GA | 20,013 |
| Austin-Round Rock, TX | 15,327 |
| Charlotte-Concord-Gastonia, NC-SC | 13,258 |
| Tampa-St. Petersburg-Clearwater, FL | 11,683 |
| Orlando-Kissimmee-Sanford, FL | 11,367 |
| Nashville-Davidson-Murfreesboro-Franklin, TN | 10,429 |
| Washington-Arlington-Alexandria, DC-VA-MD-WV | 9,933 |
The top 10 metro areas with the highest number of multifamily permits were:
| Metropolitan Statistical Area | Multifamily Permits: Sep (Units #YTD, NSA) |
| New York-Newark-Jersey City, NY-NJ-PA | 31,160 |
| Houston-The Woodlands-Sugar Land, TX | 15,967 |
| Austin-Round Rock, TX | 15,294 |
| Los Angeles-Long Beach-Anaheim, CA | 12,095 |
| Miami-Fort Lauderdale-West Palm Beach, FL | 11,994 |
| Dallas-Fort Worth-Arlington, TX | 11,862 |
| Phoenix-Mesa-Scottsdale, AZ | 10,717 |
| Seattle-Tacoma-Bellevue, WA | 10,580 |
| Nashville-Davidson–Murfreesboro–Franklin, TN | 8,256 |
| Minneapolis-St. Paul-Bloomington, MN-WI | 7,881 |
Click Here For the Source of the Information.
